AI for asset management is a new and exciting field. It’s also pretty complex to understand. At Boosted.ai, we endeavour to make artificial intelligence for investment management as simple and point-and-click as possible, while still offering the powerful machine learning that institutional investors require to succeed. However, we have found that “show, don’t tell” tends to work best when illustrating how machine learning interacts with your asset management models.
To that end, we created a new feature within Boosted Insights, our AI platform, called Factor Timing. We’ve already written about some of the highlights here, demonstrating how factor timing can help improve returns in different factors and showcasing some real world examples, but wanted to share more about the feature itself and some new additions to its capabilities.
Factor timing allows users to compare two quantile, factor or sector predictions our machine learning makes within the AI models they create. For example, a client can choose to delve deeper into Momentum Q1 versus Momentum Q5, or they can look at Technology versus Health Care, etc. This creates a comparison chart, with a visual reference point to help surface aggregate or single stock opportunities, risks and ideas.
There are four ways for users to interact with their models in our new Factor Timing update: Comparison Charts, Data Table, Historical Charts and Stock Data Table.
Comparison Charts
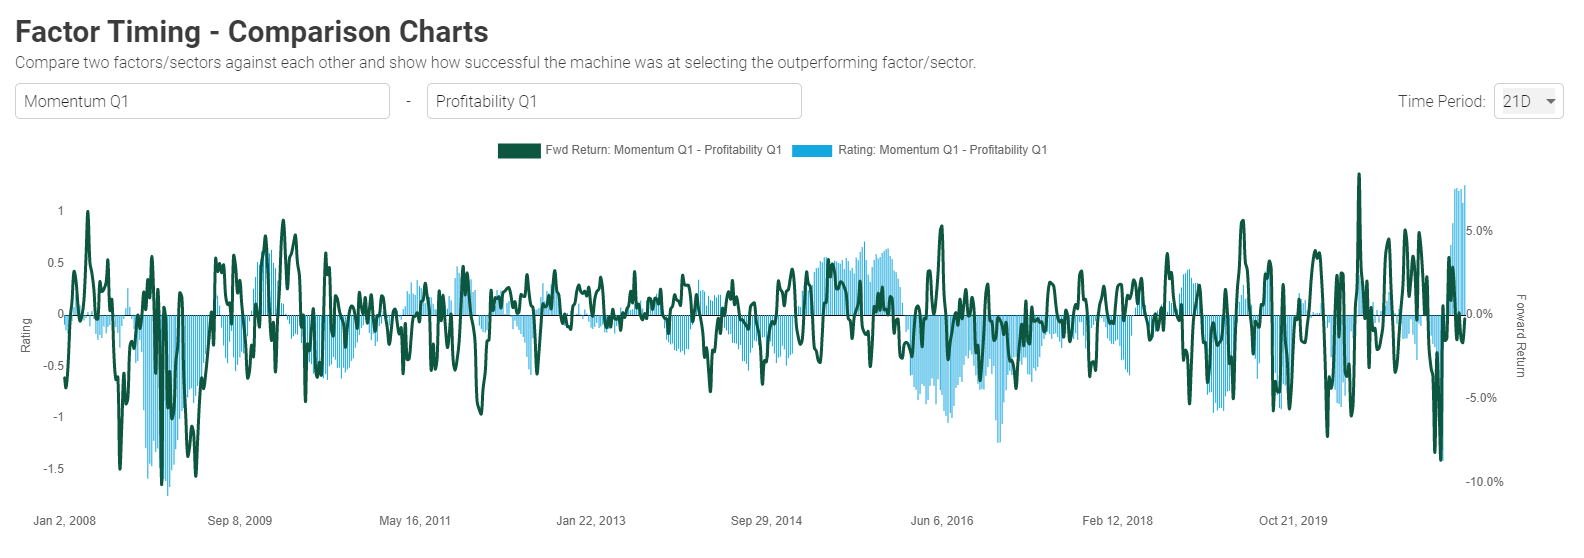
This screen lets users compare two factors or sectors against each other and shows how successful the machine was at predicting the outperforming factor or sector. The above shows Momentum Q1 against Profitability Q1. The green line represents the forward return for the selected time period (21 days in this example) and the blue bars represent the difference between the ratings of Momentum Q1 versus Profitability Q1. When the blue bar is above the X axis, our machine learning recommendation is to go long Momentum Q1 and Short Profitability Q1.
Below the chart, the performance and prediction success of the selections are highlighted, as shown here:
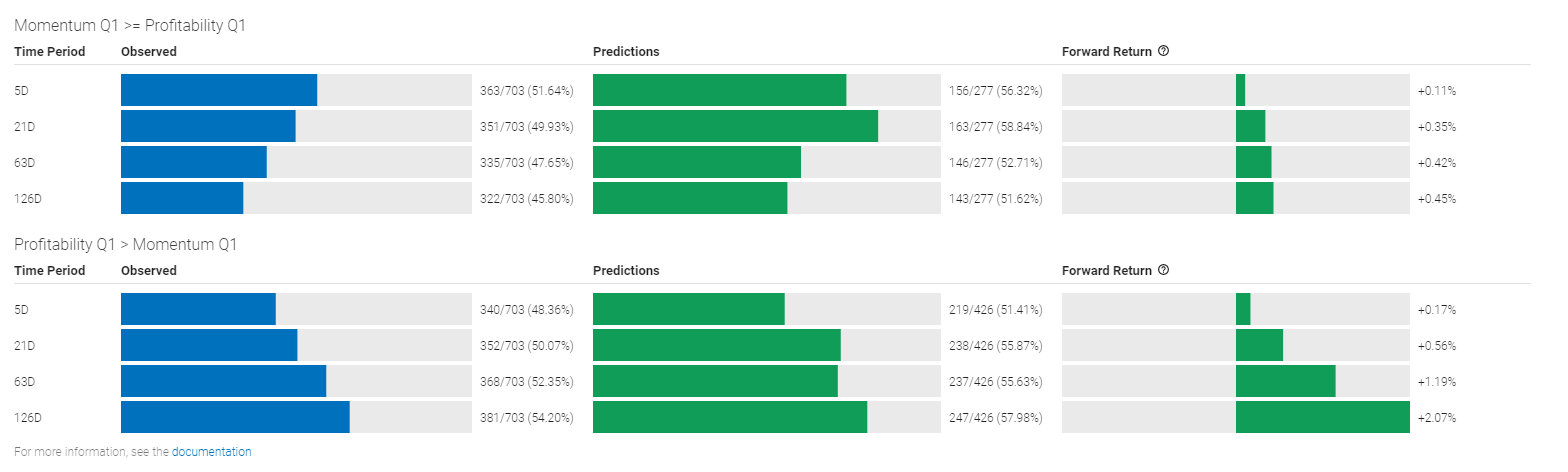
- Observed Column: shows the number of times the actual return of Momentum Q1 was at least as great as Profitability Q1 and vice versa in the bottom panel. For example on the 21D basis MQ1 outperformed PQ1 83 out of 161 rebalancing periods (just slightly over half of the time, just above 50%).
- Predictions Column: shows in denominator the number of times the machine predicted MQ1 will outperform PQ1 (and vice versa for the bottom panel) and the numerator shows how many times the prediction was correct. For example on the 21D basis, MQ1 was predicted to outperform PQ1 78 times, and 48 times (61.54%) the prediction was correct.
- Forward Return Column: shows the average forward return when going Long Momentum Q1 while going Short Profitability Q1 (or vice versa on the bottom panel) by following the prediction. Using the same example, on a 21D basis, going Long MQ1 vs. Short PQ1 is generating 40 bps return at the time the snapshot was taken.
Data Table
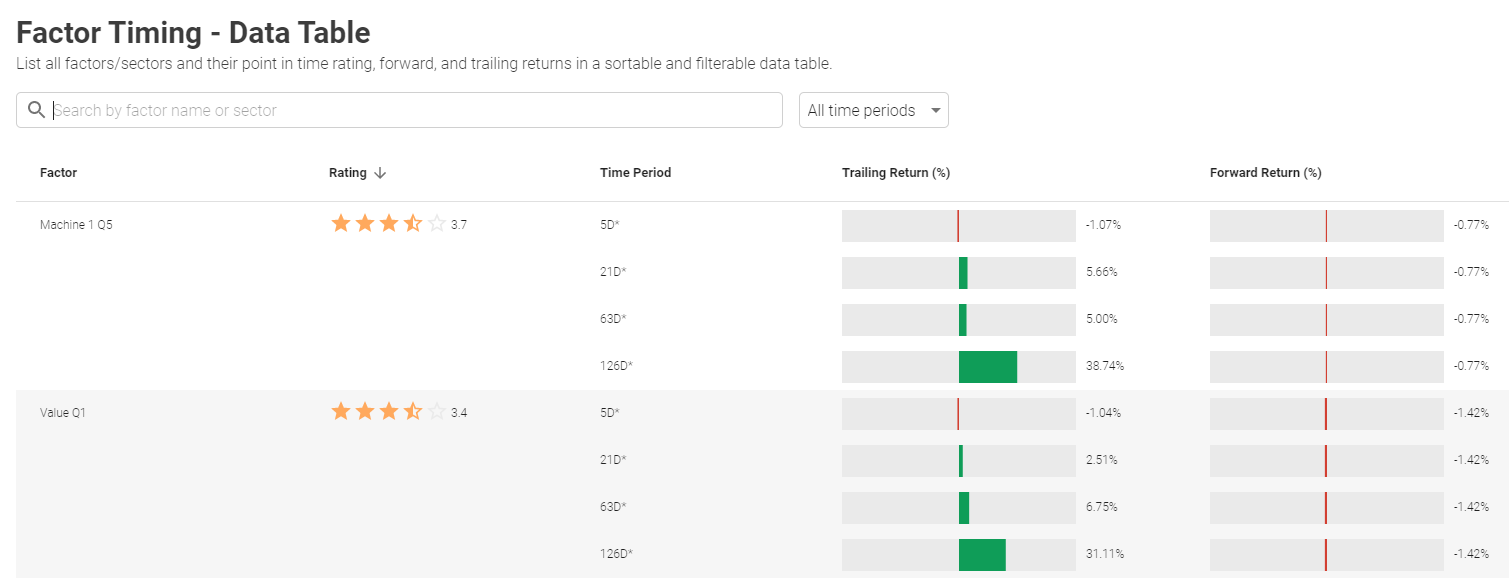
In the Data Table section, a user can see every factor and sector in their model’s universe, their point-in-time rating, forward and trailing returns in a sortable and filterable layout.
Historical Charts
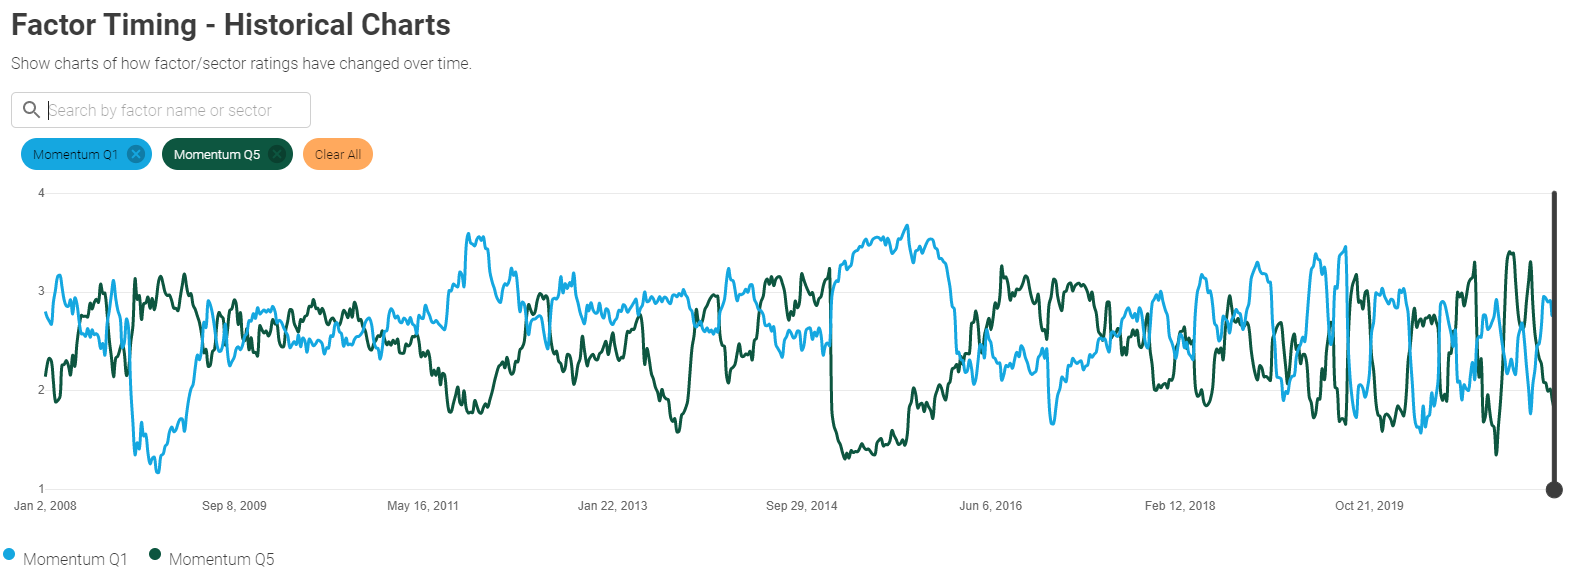
This prompt serves as a shortcut to change the top panel view to “Factor Timing” in the “Graphed Metric” dropdown. The chart showcases the factor / sector rating over time.
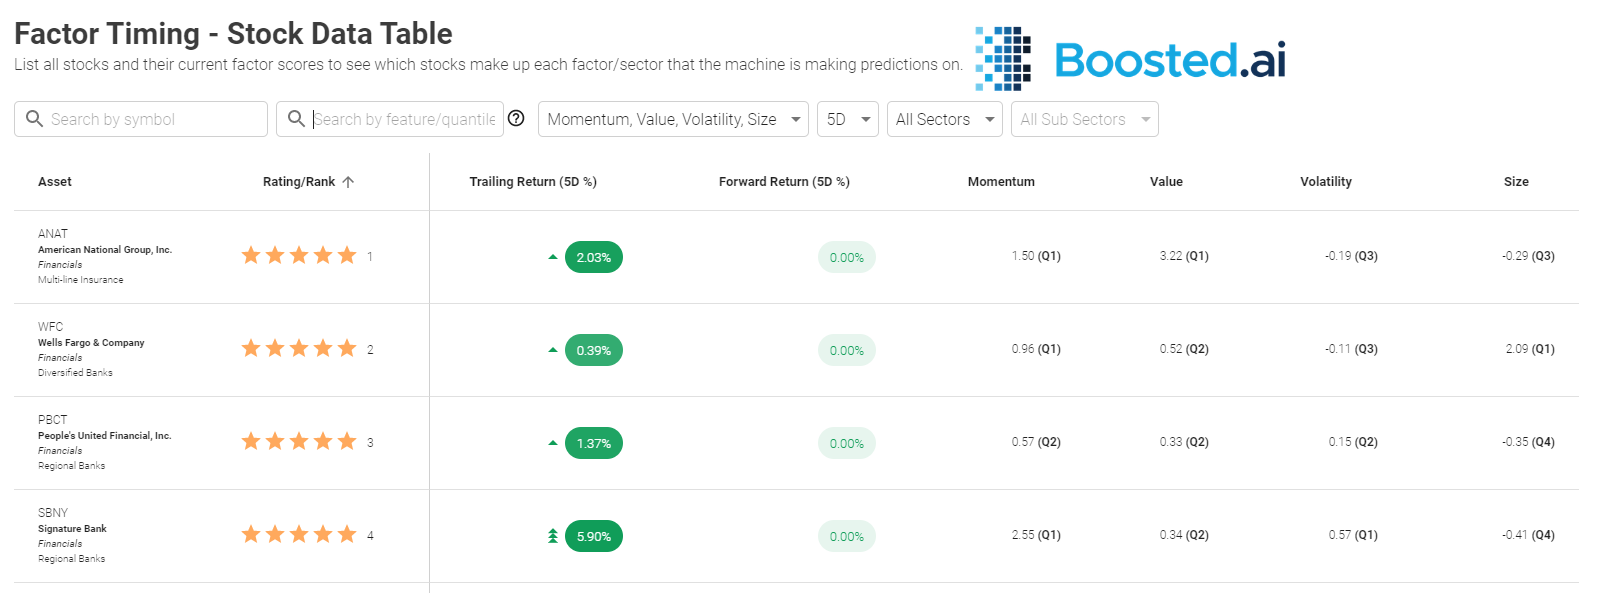
Stock Data Table
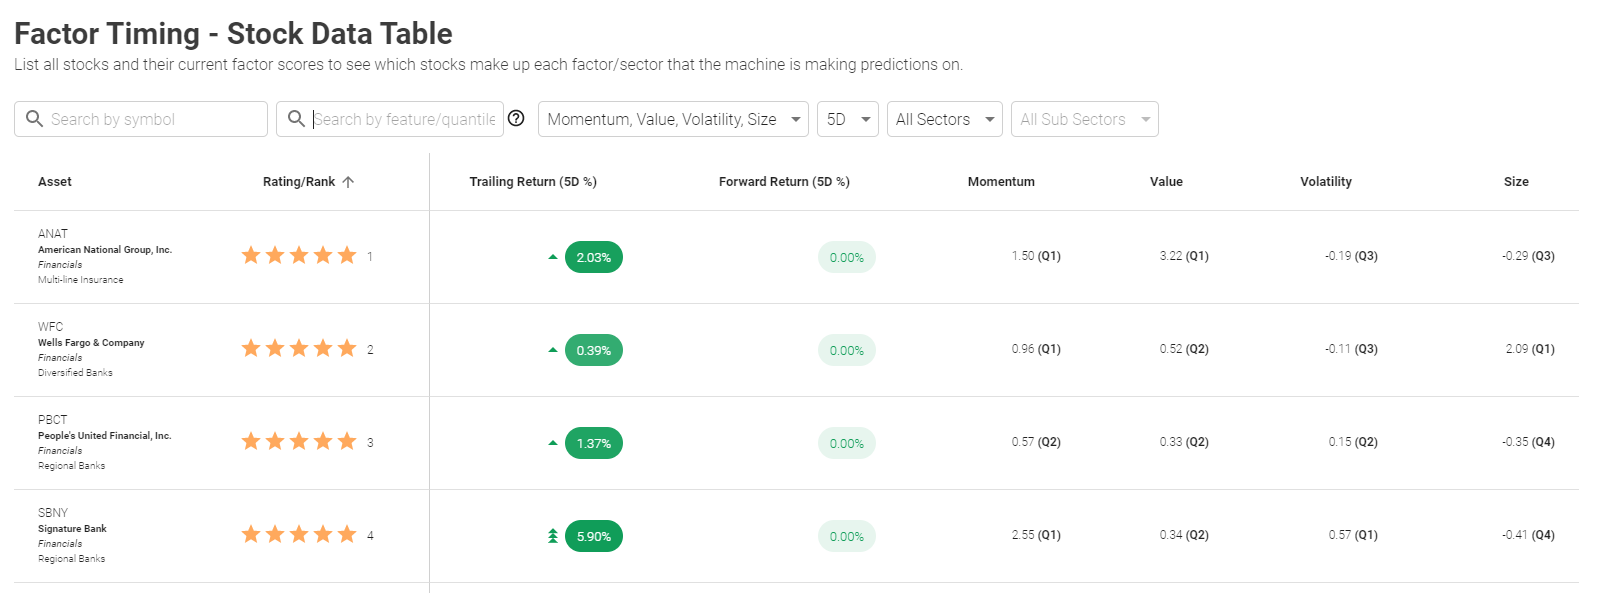
This table lists all stocks and their current factor scores to see which stocks make up each factor/sector that the machine is making predictions on. A user can filter by symbol, feature or quantile, select multiple factors to compare, or compare by time period/sector or sub-sector.
We are passionate about offering transparent, explainable AI for asset managers here at Boosted.ai. Our factor timing is one more way to give users clearer visibility into their investment management machine learning models. If you’d like a demonstration or just want to learn more, reach out to us here.