We know that institutional investors are short on time and need their data-driven insights to be understandable both from a high-level view and in deeper detail. As a complement to our Portfolio One-Pagers, we are proud to release Stock One-Pagers. These fact-filled pages illustrate how the asset manager’s machine learning model thinks of every equity in their universe and give a bird’s eye view of the biggest positive and negative drivers of that stock. We’ll walk through this new addition to Boosted Insights – our artificial intelligence platform for investment managers – here.
Top section
Ratings
The ratings section showcases a plot of the machine learning driven star ratings at each rebalance for the selected date range for the security.
Price history
The price history section showcases the price history for the selected date range for the security.
Excess return and hit rate
Excess return shows the average excess return of all stocks in the user’s machine learning portfolio, stratified by the star rating across multiple time periods. The hit rate is the percentage of times that the security’s star rating buckets – across multiple time periods – had a positive excess return.
Rankings
The rankings section shows the AI-driven star rating, the security’s rank against all other securities in the portfolio (and its change, or delta) and its explain score at the last portfolio rebalance date. Below, the top 5 positive and negative drivers of the explain score are shown.
Bottom section
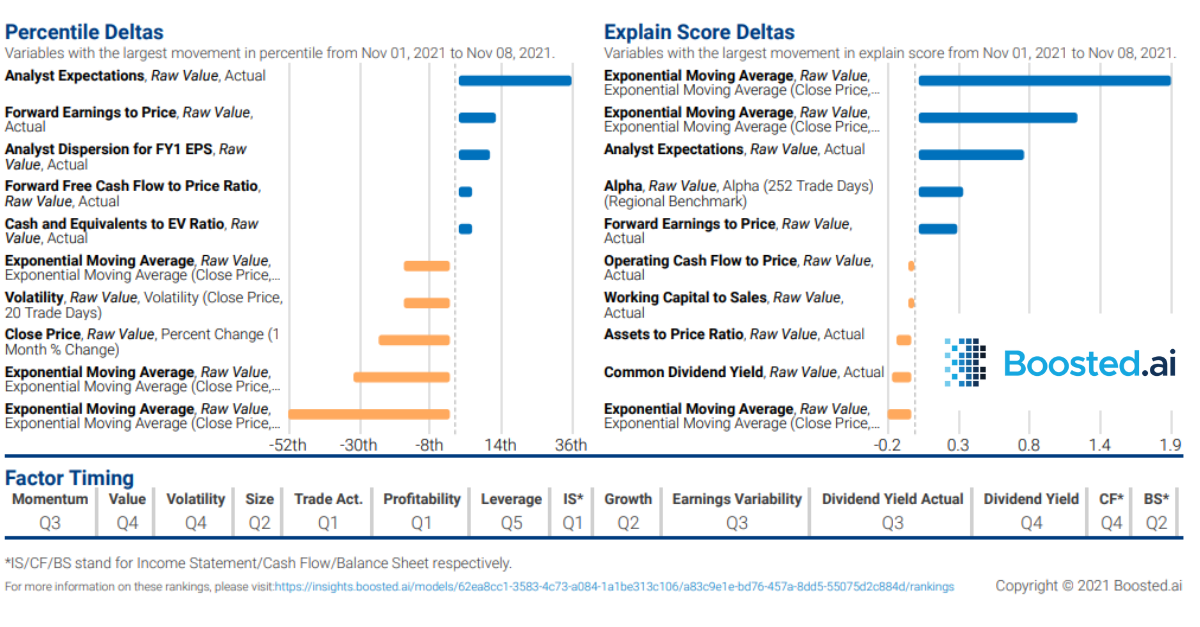
Percentile deltas
The percentile deltas section shows the drivers with the largest change in their data percentile, ranked from highest positive to highest negative change. This showcases how the importance of the AI model variables changed at the rebalance date from the perspective of its data percentile ranking.
Explain score deltas
The explain score deltas section shows the drivers with the largest change in their explain score, ranked from highest positive to highest negative change. This showcases how the importance of the AI model variables changed at the rebalance data from the perspective of its explain score.
Factor timing
This section showcases where the ranking of factors affecting the stock fall on a quantile basis from Q1 to Q5.
Using the stock one-pager in real life to get additional insight into your AI-powered investment management
Step 1:
An investment manager builds a machine learning model with our AI platform, Boosted Insights. Our customer success team is always here to help in the model/portfolio creation process (and beyond!). Once the asset manager has created and honed a model they like, they’re ready to start using it. Many of our fundamental managers like using their ML portfolios for equity idea generation.
Step 2:
The asset manager selects the stocks they are most interested in within their coverage universe. Many asset managers and analysts cover entire indexes but are specifically interested in a smaller number of names, typically within a specific sector, like healthcare, energy or tech.
Step 3:
The investment manager logs into Boosted Insights and gets rich, data-driven insights on their list of specific stocks, which can help them make portfolio allocation decisions. The manager generates one-pagers to capture all relevant AI insights in an easy to use format to have at their fingertips. The one pagers can also be shared amongst their teammates as a visual tool to use in meetings when reviewing investment ideas.
Takeaways
Having machine learning driven insights at the ready for every equity in their portfolio is just another way we are driving value for institutional investors at Boosted.ai. For a more thorough walkthrough of this new product feature, please reach out to us for a demo.
