Executive Summary
- Using AI can help asset managers find performance within their own portfolios
- Risk factor constraints and AI portfolio optimizers are one of the ways to utilize machine learning today
- Our portfolio with factor constraints has outperformed IWB by 29.33 percentage points since September 2020
- Our AI portfolio without factor constraints has still beaten its benchmark, but only by 2.23 percentage points.
Last August, we shared how our machine learning models performed using our factor constraints. We highlighted how using portfolio optimizations and factor constraints within our machine learning platform – Boosted Insights – we were able to improve portfolio returns by over 10% during the March 2020 market crash. Though August 2020 feels like a lifetime (or two) ago, it was actually only 10 months, so we thought it would be a good time to share how those models have performed in the time since.
The model we showcased in August and will share again here is based on the Russell 1000 Index (IWB). It uses our proprietary Battle Royale Noise Reduction algorithm and rebalances weekly, retrains quarterly and has a 21 day investment horizon. This model has 100 long positions and 100 short positions, in a ratio of 150% long to 50% short. We have two versions of this model, with different portfolio optimizations. The first is our model with no factor constraints, which we will shorten to R1K NFC here. The second is the same model with different portfolio optimizers and factor constraints used, which we will shorten to R1K WFC.
Each portfolio contains the same 100 long and 100 short positions – the only difference is in how we applied our machine learning portfolio optimizers and factor constraints to determine portfolio weightings.
Russell 1000 No Factor Constraints (R1K NFC)
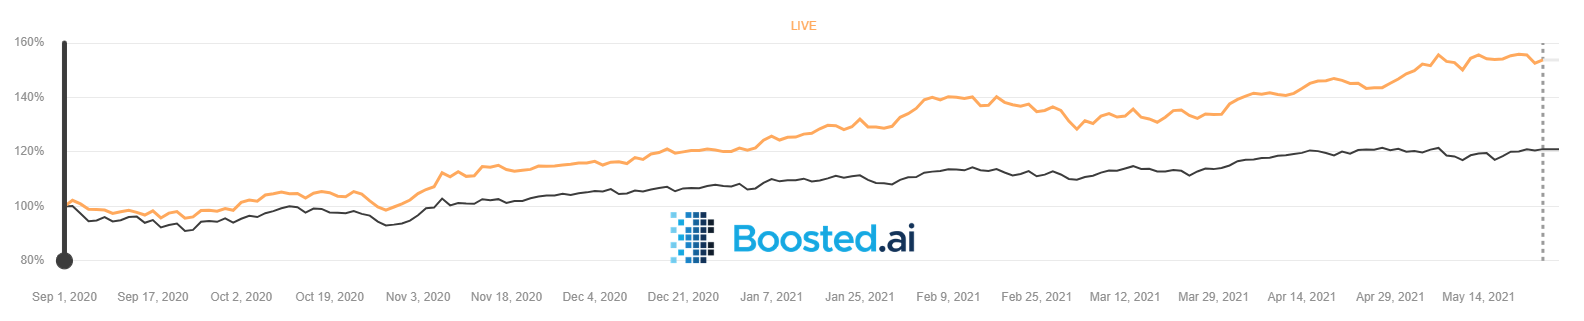
Since September, our R1K NFC portfolio has outperformed the benchmark (IWB) by 2.23 percentage points. The screen from Boosted Insights below highlights that there were indeed months where the portfolio underperformed, but cumulatively, it has beaten IWB.
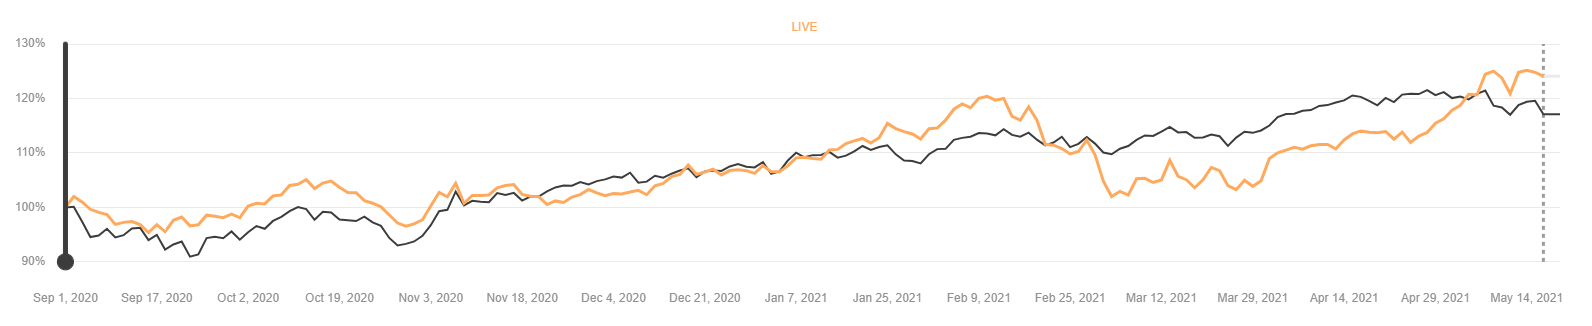
This showcases the importance of what we try to highlight – that machine learning does best with as many hits at bat as possible, and that overall, will tend to outperform the underlying benchmark on a slightly longer term.
Russell 1000 With Factor Constraints (R1K WFC)
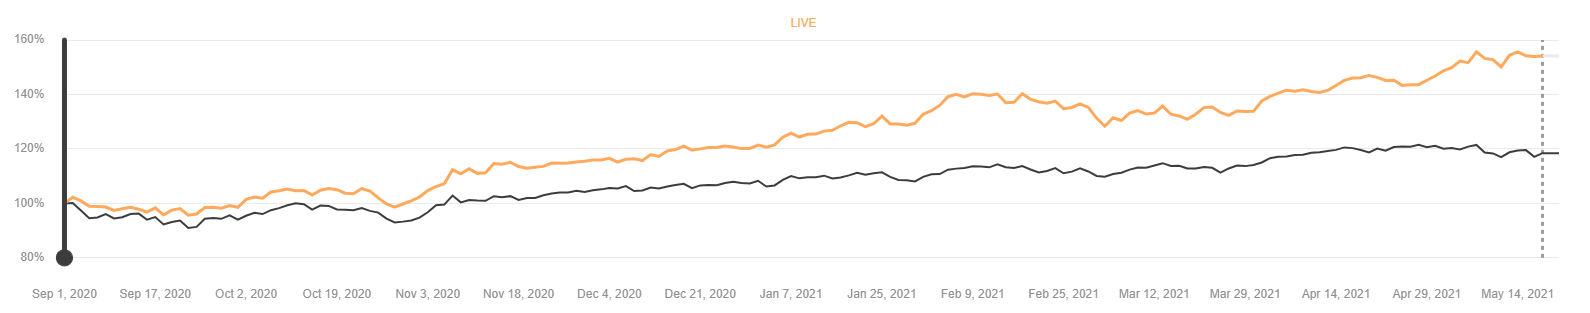
Since September, our R1K WFC portfolio has outperformed the benchmark (IWB) by 29.33 percentage points. Its chart, seen below, shows a much clearer upward direction against the benchmark. Remember, these are the exact same portfolios (100 stocks long, 100 stocks short, in a ratio of 150% long, 50% short) – so, what’s the difference?
Factor Constraints
The R1K NFC portfolio does not utilize any of our artificial intelligence optimizers. The R1K WFC portfolio does. The main optimizer it implements is our Reduce Risk optimizer, where it optimizes for the below factor constraints. These are our machine learned factors. A machine learned factor could be something like Covid-19, news of a vaccine, the Suez Canal blockage – anything that our machine learning can begin to see as a risk factor for a particular group of stocks.
In March 2020, this factor constraint analysis saw groupings of equities lumped together under certain risk factors that might not be intuitive to the end user – like how retailers like Nordstrom (JWN) and Ralph Lauren Corporation (RL) seemed less likely to be affected by Covid-19 than Under Armour (UA, UAA) and Capri Holdings (CPRI).
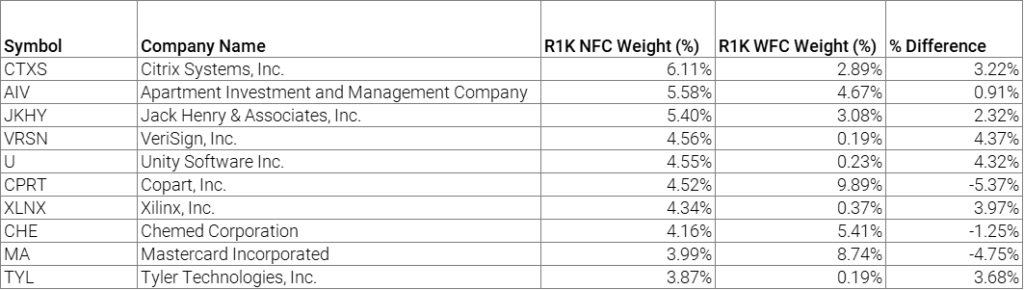
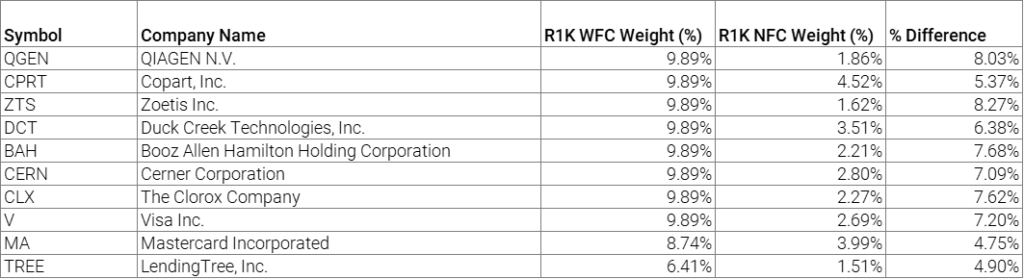
Our portfolio that controls for these risk factors (R1K WFC) set bounds for these factor constraints to stay within, which functioned to lower risk but also improve return. The two tables below showcase the holdings of each portfolio on the same day, March 29, 2021 (the beginning of the week of April 1, 2021 – because this portfolio rebalances weekly on a Monday). Though each portfolio is made up of the same 100 equities, the top 10 holdings are almost entirely different, due to our risk factor constraints. The fifth column highlights the weighting differences between the equities in each portfolio. The R1K With Factor Constraints portfolio has many equities listed at 9.89% weight, essentially the highest the portfolio construction of this portfolio allows – most likely indicating that these names don’t have large risk factor exposures.
Results
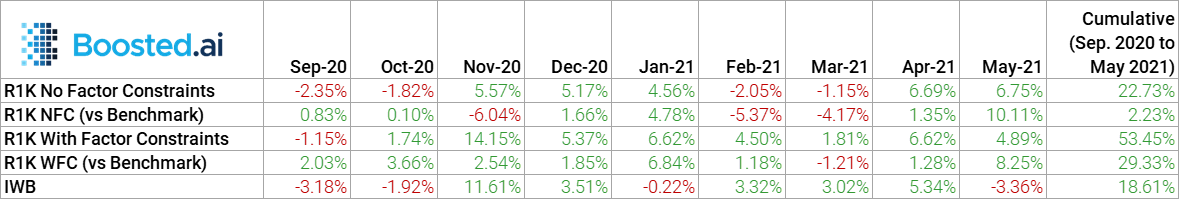
This is how both portfolios have fared since September 2020. The stock market has had a great run, seen in IWB’s 18.61% cumulative return since September 2020, but both of our models beat IWB. The R1K No Factor Constraints model outperformed by 2.23 percentage points and the R1K With Factor Constraints outperformed by a stunning 29.33 percentage points since September 2020. Using these factor constraints and artificial intelligence optimizers, the R1K WFC portfolio has only underperformed IWB once in the past 9 months.
Takeaways
Every asset manager can find value in implementing artificial intelligence. The results of our AI factor constraints portfolio – where we beat the benchmark by 29.33 percentage points and outperformed every month except March 2021 – are proof that investment managers looking to add alpha to their portfolios can find performance by adding machine learning to their process.
If you want to learn more about how we created this portfolio, or how adding AI to your investment process could help your portfolios, reach out to us today.